


The NFL season just kicked off last week. So you might be making some bets about who’s going to come out on top. Or maybe, you’re thinking about the right defense to draft during your fantasy league.
In either case, the NFL’s history gives us a pretty rich dataset to predict future NFL outcomes.
In this write-up, we’re going to use Analyzr — a no-code machine learning tool — to build a predictive model and discover which teams are most likely to head to the Superbowl, and win.
(We’ll do our best, but hey, we can’t guarantee 100% accuracy. So place your bets at your own risk!)
Structuring the Problem & Data
With all the data available on NFL players and games, there are many different ways we could structure this problem. So we’re going to focus on predicting the likelihood of an NFL team winning the Superbowl, which sets up a few things for us:
- The outcome we are trying to predict is binary – only one of two outcomes can happen, a team either wins or does not win the Superbowl. This is our dependent variable.
- We know there are 32 NFL teams per season, and only 1 team will win the Superbowl – meaning the positive outcome we are looking to predict is infrequent (this will matter later).
- We need to build a data file each team that has one row per season.
Let’s start building out our data file, by thinking of some hypotheses. This will help us identify what data points we should collect and what independent variables to select later on.
What do we think drives a team’s likelihood of winning the Superbowl? Here are some of our thoughts:
- The more a team wins the more likely they are to win the Superbowl – we should include # of wins per season.
- Football strategies and teams are built around offense vs defense – we should include data points that highlight the performance of both sides of the team.
- Teams can change pretty drastically year to year because of the draft, but a team’s historic performance matters to a certain extent – we should include data points that highlight a team’s historic performance, perhaps some previous year stats or rolling year averages.
- Quarterbacks are an integral part of the game (look at Tom Brady’s impact for example) – we should include data points that cover a team’s quarterback performance, like passing yards.
Once you have gathered a set of data points into a file, we can upload it into Analyzr to explore the data.
Exploring our Data
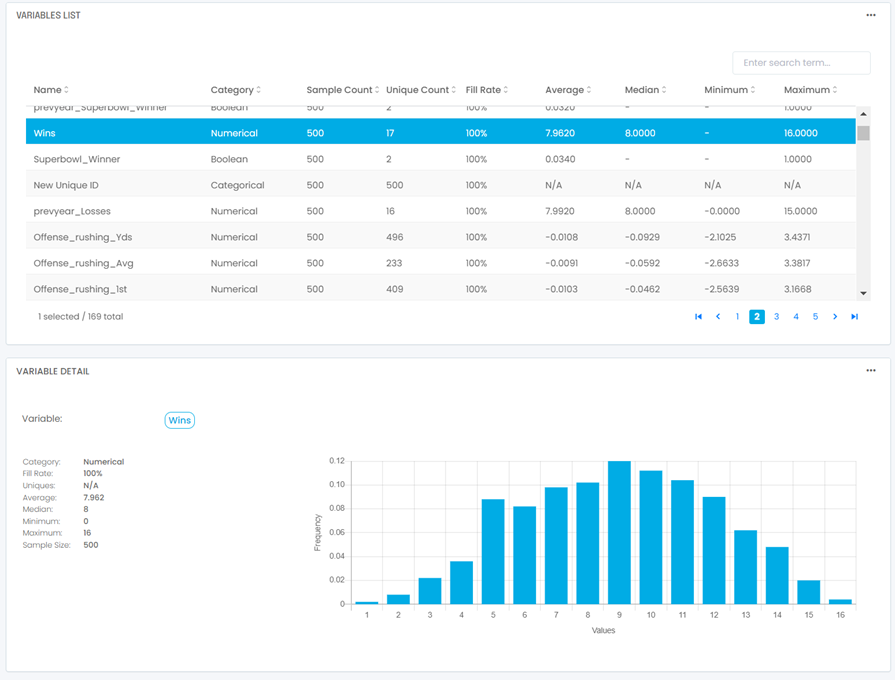
Once we have a data file to work with, it’s time to explore our dataset. During this stage of the model building process, we want to get familiar with the data to check for a few things:
- Ensure your data was loaded in the correct format(s) – did everything flow through correctly in the way it was supposed to? Do I see the number of rows I expect to?
- Validate the distribution of values across your data points and identify outliers you may need to address later on — are you seeing all the values for your categorical variables, or is your data skewed? Do your mins/maxes/averages make sense for your numerical data points or do you have outliers?
- Identify existing relationships in your dataset – do you have data points that are already related to each other?
Once we took a closer look at NFL team data by season, we noticed a few things that needed addressing before moving on to training our model:
- While you can find decent NFL season data dating back to the 1960’s, the strategy and rules used to play football has drastically changed over the last 60 years.
For example, way back when it was all about rushing, but over more recent years the game has turned more passing-oriented than before. The specialization of players has drastically changed over the last 40 years, where players are drafted just because they are very good at one thing.
These foundational NFL changes mean it doesn’t make sense to go as far back as 1960 as we would be introducing known biases that don’t apply to the current world of NFL football into the model. We limited our dataset to include data from the 1992 regular season and beyond.
- We see high variability in team performance season to season due to a few reasons: over the entire course of the NFL we have seen ‘all star’ players rise who shatter records and drive team performance but players can only stay in the NFL for so long, as well as players can shift between teams often and drastically due to the way draft picks work.
This variability in team performance season to season reduces the value of raw data points and highlights that we actually need to understand a team’s performance relative to the other teams in each season, not over time.
Because of this, we standardized our raw data points to z-scores for each season, which tells us how far off a team was compared to the average of all the teams for that season. (For example, it’s doesn’t matter to us that Team A had 27 offensive touchdowns in the 2018 regular season, but it does matter to know Team A had an offensive touchdown total that was 1.5 standard deviations below the average mean for all teams in the 2018 regular season)
Once we have a clean data file we feel confident is good to go, we’re ready to start training!
Training a Reliable Model
We first need to identify the type of model we’re going to build. Going back to one of our earlier statements, that the outcome we are trying to predict is binary, we’re going to build a propensity model.
When it comes to training a predictive model, you are never training just one model, but rather testing different sets of input parameters described below to see which leads to the best results:
- Algorithms – Analyzr has 20+ algorithms across model types; different algorithms work better with different types of data sets.
- Input Variables – We don’t know what drives an outcome, which is why we are building this model, so we need to test different sets of independent variables to help get that understanding. If you identified 2 datapoints during explore that are already related, you might test which performs better.
- Pre-processing steps – Analyzr gives you the option to turn on/off additional pre-processing, which for propensity would be enabling SMOTE. SMOTE should be used if the outcome you are trying to predict happens infrequently in your data set, as it generated additional positive data points for the model to work with to build a reliable model.
We trained a few different models with these settings, and ended up with a model that looks like this:
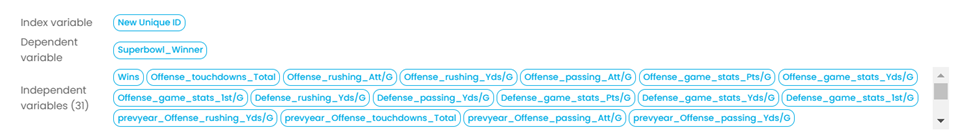
- 31 independent variables, including a mix of offensive and defensive stats for that Superbowl’s regular season, as well as the same stats for the previous season.
For example: for the Superbowl outcome in 2020, the 2019 regular season stats and 2018 regular season stats were included for each team:
- XGBoost classifier – this worked best for our dataset given it is unbalanced (in 30 years of data, we would only have 30 positive outcomes in over 900 data points).
- We enabled SMOTE pre-processing, again, because of our unbalanced dataset.
When it comes to training your model, train your model on a portion of your dataset — ideally, at least 50% — and set aside the other portion for test or validation, to see how “good or bad” your model is.
Analyzr makes it easy to see how much data you want to set aside for testing using a scaling bar, and randomly generates your train vs test samples. However, in our current problem context, that won’t work because we need to ensure seasons do not get split up between train vs test samples. So, we manually created our train vs test datasets by randomly assigning each Superbowl season from 1992-2023 to test vs train, and then manually created each file to ensure all records for each season were put in the appropriate sample.
Understanding Model Drivers & Performance
Analyzr breaks down propensity results in a few different ways, starting with showing you a driver ranking chart.
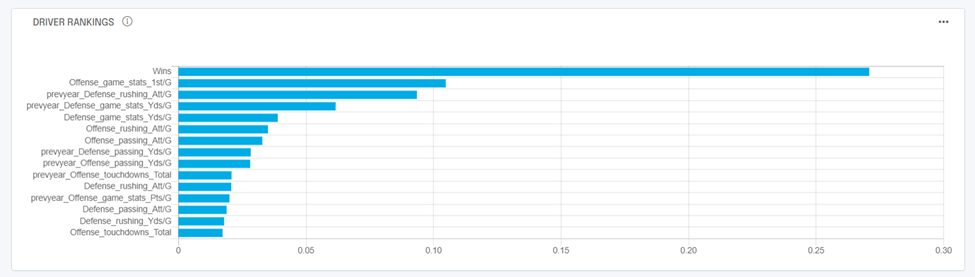
This tells you, out of all your inputs, what really matters when it comes to predicting your outcome.
In our case, when it comes to predicting a Superbowl winner, the # of Wins and 1st downs per game for the regular season are the top two drivers, followed by a few stats from the previous regular season.
Analyzr continues to break down your results by calculating the typical default propensity metrics like Precision, Accuracy and F1 score.
But since we are in a unique situation with our problem context, and analyzing seasons with one outcome, we need to validate our model a little differently. For each of the 8 seasons of data we set aside for test/validation, we want to understand if the highest-scored teams per season by our model are the ones that actually ended up playing and/or winning the Superbowl.
We can do this by uploading our test file to predict in Analyzr, and then comparing the model’s predicted score, to the actual results of each season, and see what happened.
The below tables breaks out various validation metrics for us:
| Year Superbowl Played | Predicted Superbowl Winner | Superbowl Winner in top 3 highest predicted propensity scores | Superbowl Winner in top 5 highest predicted propensity scores |
| 1997 | 1 | 1 | 1 |
| 2003 | 0 | 1 | 1 |
| 2010 | 0 | 0 | 1 |
| 2012 | 0 | 0 | 0 |
| 2015 | 0 | 0 | 0 |
| 2017 | 1 | 1 | 1 |
| 2019 | 0 | 0 | 1 |
| Overall Stat | 29% | 43% | 71% |
Overall, our model is performing okay, given the amount of inputs and data granularity we went into.
The model correctly predicted the Superbowl winner 29% of the time. So it’s able to give you a 1/3 betting odds chance of predicting the Superbowl winner 43% of the time, and so on.
While it may seem like this model doesn’t help much, in the context of making smarter bets, it definitely can help put you on a smarter path – helping you increase the odds you’re making the right choice!
There would be room to improve this model by continuing to chase down additional, impactful season data points, and breaking down the data to a deeper granularity, like weekly stats.
Initial Bets for Superbowl LVIII
So, now you’re wondering, what about the upcoming Superbowl for 2024?
Can we make predictions for that? We can definitely make some initial predictions using some assumptions, since the 2023 season has just begun.
Remember, our dataset is made up of data points from that Superbowl’s regular season, as well as the previous regular season. So, for the Superbowl played in 2024, we want to include the 2023 regular season and 2022 regular season stats. Since we already have 2022, we can use that as an initial proxy for 2023, until we have a few weeks of data ready to make some updated predictions. (Our predictions over the season will become more accurate.)
Using this proxy, the top 5 highest scored teams most likely to win the Superbowl as of right now are:
- Kansas City Chiefs
- Philadelphia Eagles
- Buffalo Bills
- San Francisco 49ers
- Cincinnati Bengals
Note, these predictions wouldn’t account for big team changes that took place going into the 2023 regular season.
Follow our blog here to see our next update about halfway through the 2023 regular season to see updated predictions!
You can sign up today for a free Analyzr account, here.